These prices are sourced from Realtor reports as available. The numbers reported are the average of all sales, not the median. It will be updated monthly when numbers are available.
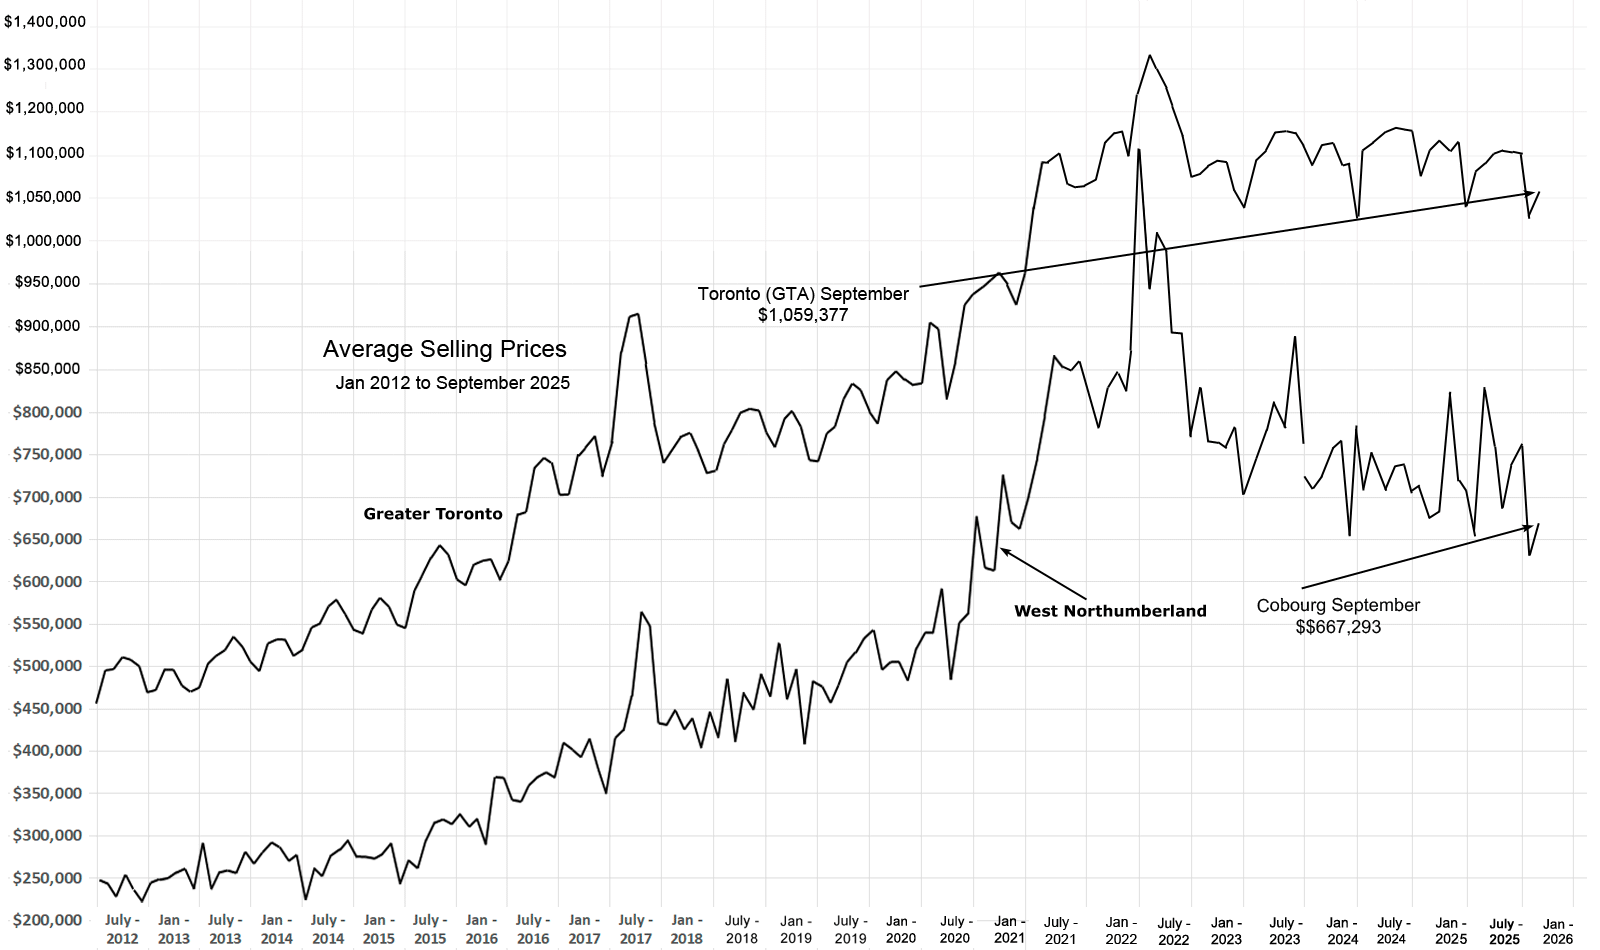
Prices for GTA have been virtually flat since July 2021 but Cobourg prices are noticeably down - with more volatility due to the smaller market - see graph.
|
Cobourg
|
GTA
|
|||
| August | September | August | September | |
| Average sell Price | $630,076 | $667,293 | $1,022,143 | $1,059,377 |
| # Sales | 27 | 29 | 5,211 | 5,592 |
| New Listings | 76 | 105 | 14,038 | 19,260 |
| Active Listings | 189 | 192 | 27,495 | 29,394 |
| Sell Price to List Price | 96% | 97% | 97% | 98% |
| Days on Market | 45 | 50 | 33 | 33 |
Sales for Cobourg in September 2025 were 59% detached homes. Number of active listings is at month end.
As usual, click the image to enlarge.